The etracer software version 2.xx GUI
Introduction
The GUI (Graphics User Interface) in the etracer software is simple yet effective. The seven tabs below the curves plot area controls the operating mode of the software.
There are three tabs provide three basic modes of measurements: [Quick Scan], [Full Scan] and [Corners]. [Quick-Scan] is designed to perform a quick measurement around a quiescent operating point. This test is similar to the test performed by a tradition tube tester such as Hickok TV-7 with more parameters generated. The [Full Scan] test scans the plate-volt vs. plate-current curves at different grid bias and plot the result. The [Corners] test tests the DUT under extreme voltage conditions.
The [Combo] tab allows the user to compose a combination of three basic test modes and it has the ability to detect an insertion or a removal of a DUT. This mode is useful for testing a tube lot of the same type.
The [H-C Leakage] tab allows user to test the leakage current between the heater and the cathode of a vacuum tube.
The [Basic Params] and the [Load Line] tab allows users to perform real-time analysis of the full-scan data.
Quick-Scan mode
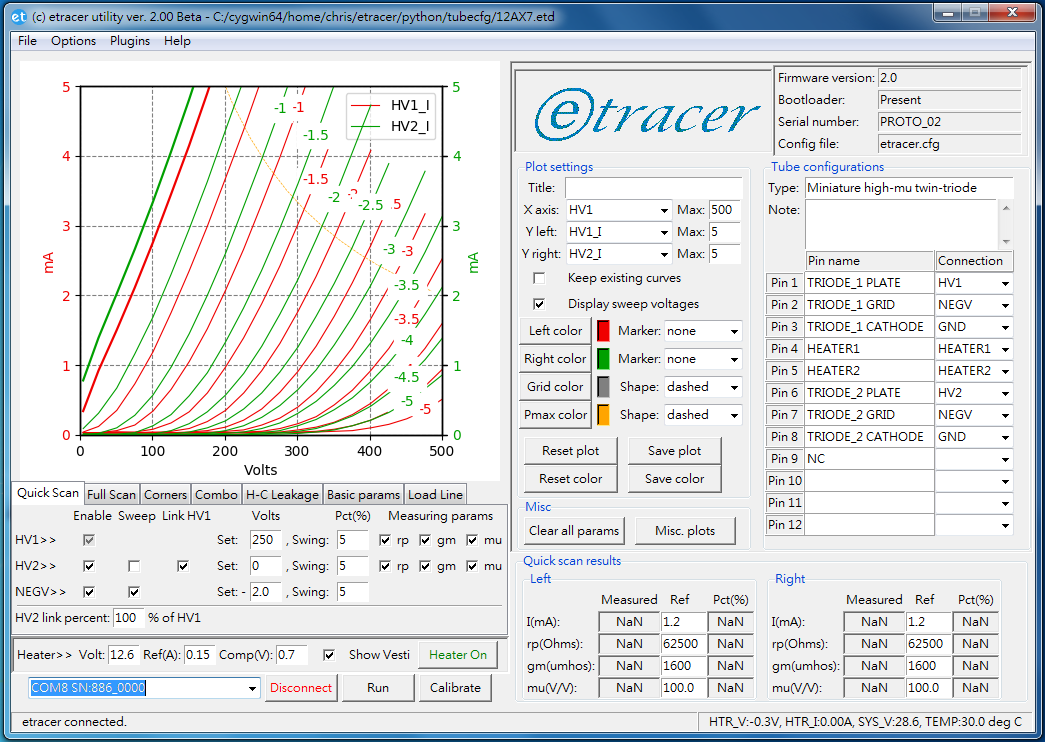
In the [Quick Scan] mode the user specify the quiescent operating point for a vacuum tube DUT (Device Under Test) and the software output the measured parameters at that operation point. The Output parameters are: mu, gm and rp. The following is an example output of a measurement made on a 12AX7. Both section are measured simultaneously.
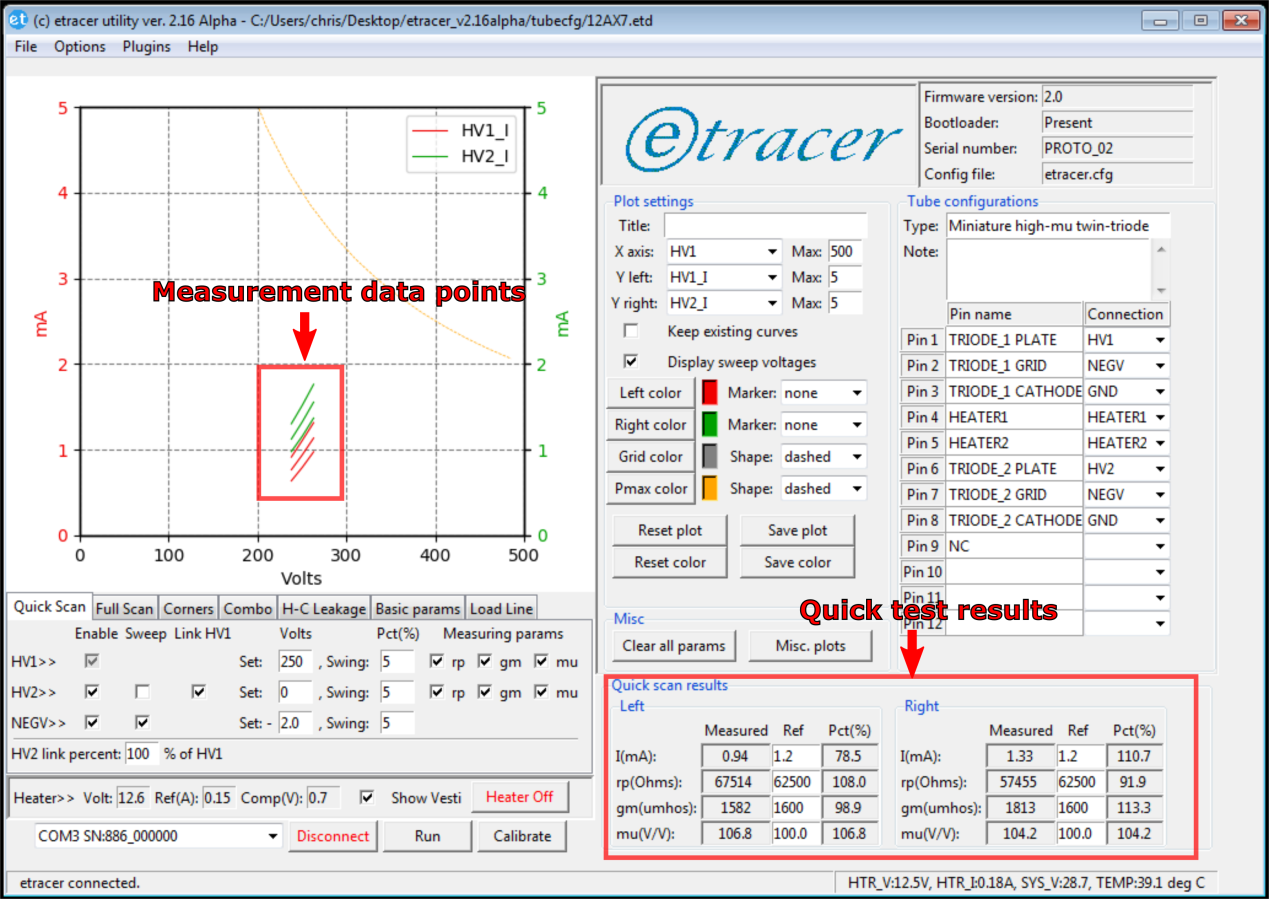
Example output of the Quick-Scan measurement of a 12AX7
Full-Scan mode
In the [Full scan] mode the user defines the sweeping ranges and sources for the plate electrode, the grid electrode and possibly a second grid electrode (For pentodes) or a second plate electrode (For Twin-triodes). The software performs a quick curve-tracing following the configured parameters and the curves will be displayed on the screen gradually. The data points can be saved to a file in the CSV (Column Separated Values) format for further analysis such as matching. The plot can be saved in different format such as JPG and PDF in high resolution. The following figures are some example outputs for a full-scan.
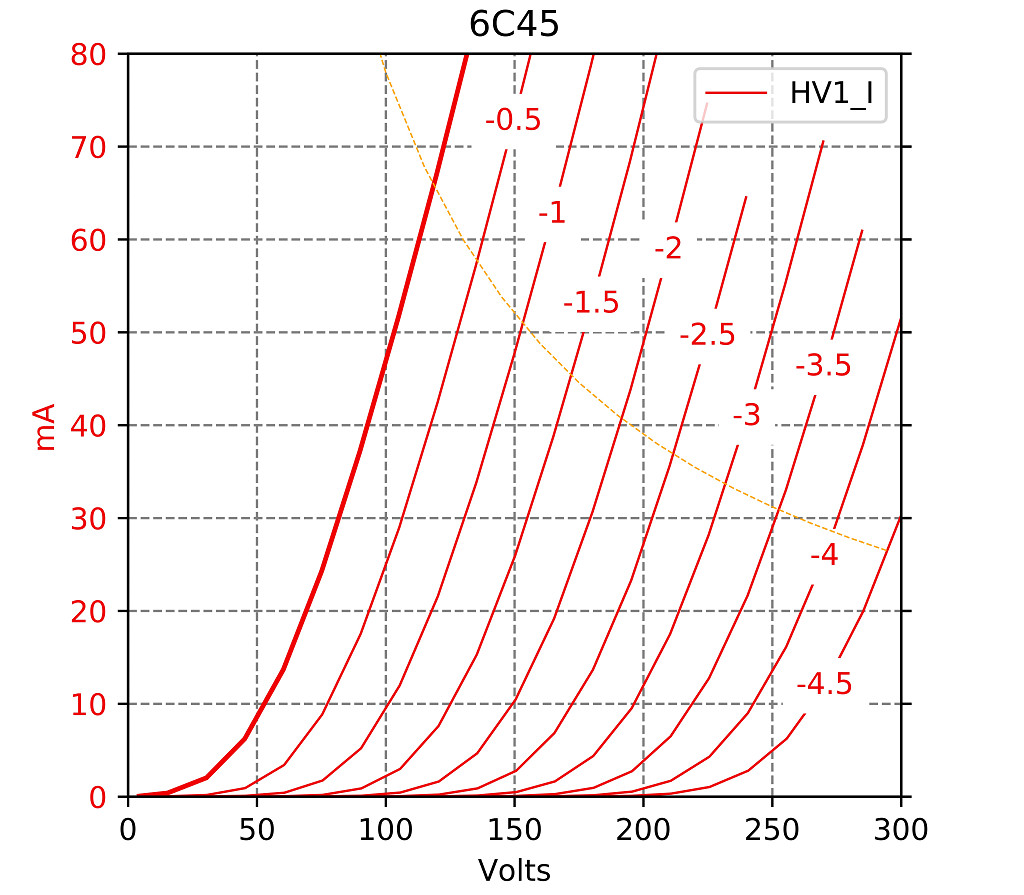
Full-Scan of a Russian 6C45 triode tube

Full-Scan of a Telefunken EL-156 power pentode with screen biased at 250V
Corners test mode
Under the [Corners] test mode up to four sets of criteria can be configured to test the DUT under extreme voltage conditions. This mode is unique to etracer and is not possible for other tube testers that has insufficient voltage output. For more information of why the [Corners] test is necessary please refer to the following article:
Why you need a tube tester that goes up to 750V?
The output of the [Corners] test is pass or fail for each test criterion. The supplied tube configuration files use the first two test cases for cut-off region anomaly detection and high-voltage short detection respectively. The following figure is a sample output of a Corners test for a 12ax7.
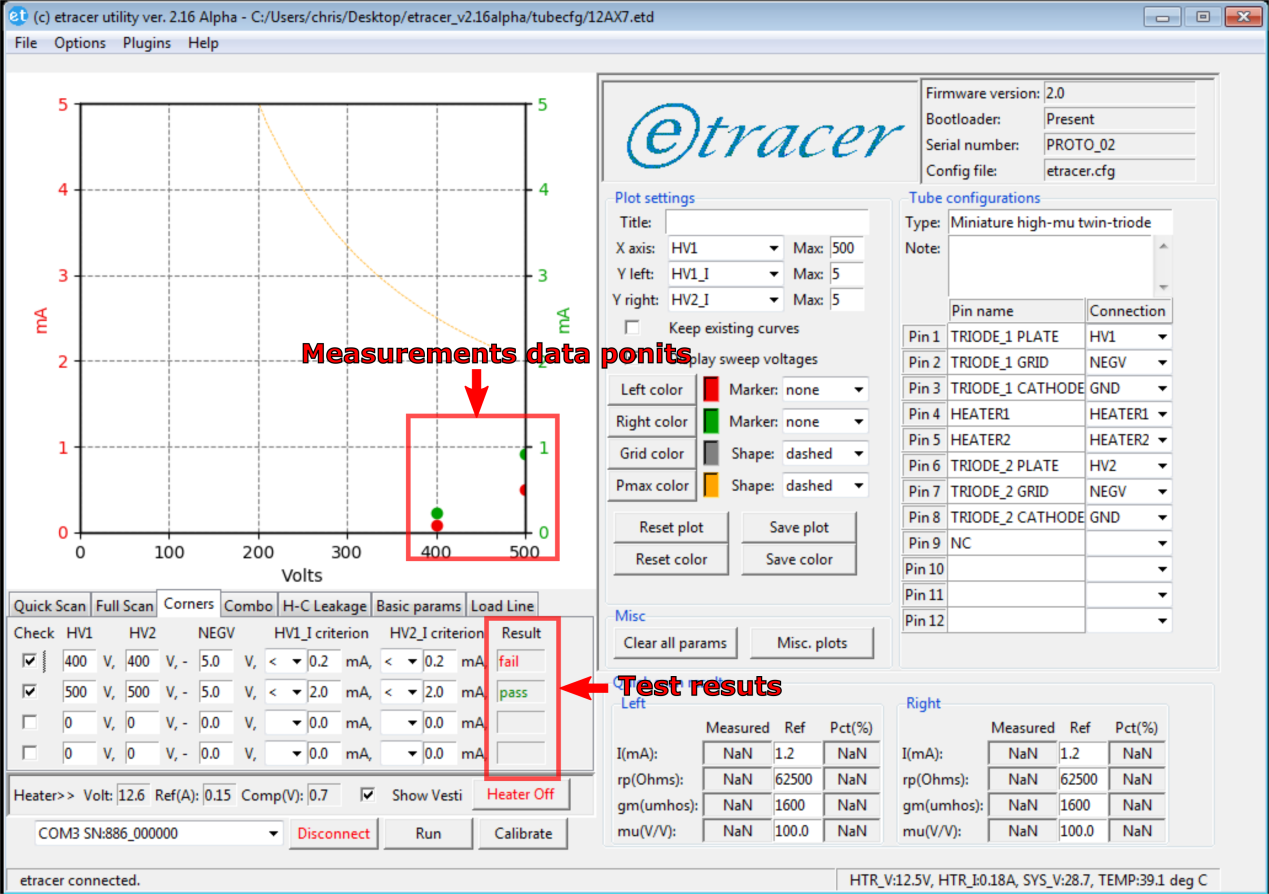
Sample corners test output for a 12AX7
Combo test
The [Combo] test is designed to perform a combination of the three basic tests (quick-scan, full-scan and corners) sequentially (full-scan → quick-scan → corners) with a single trigger. It is especially useful when the user want to test a batch of tubes of the same type. The combo test is further automated by an auto-DUT-insertion-detection feature and a countdown counter that triggers the test when expired. For the test result the user can select different output format to save. The output file name has a sequential number which is incremented by one after a combo test is done automatically. A sound effect can be played at the beginning and the end of a test. The following figure illustrate the control interface of the Combo test.
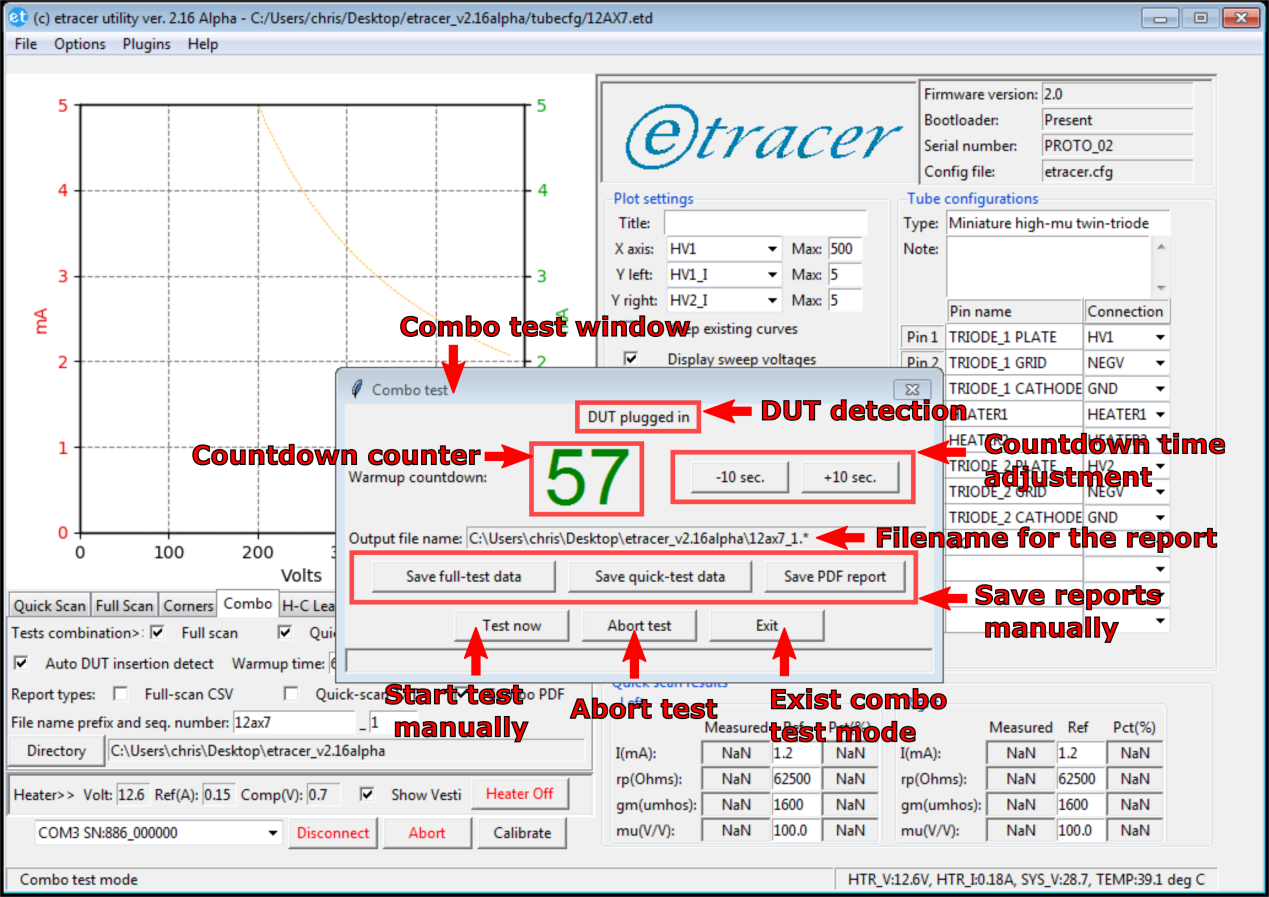
User interface of the Combo test
Heater-Cathode leakage test
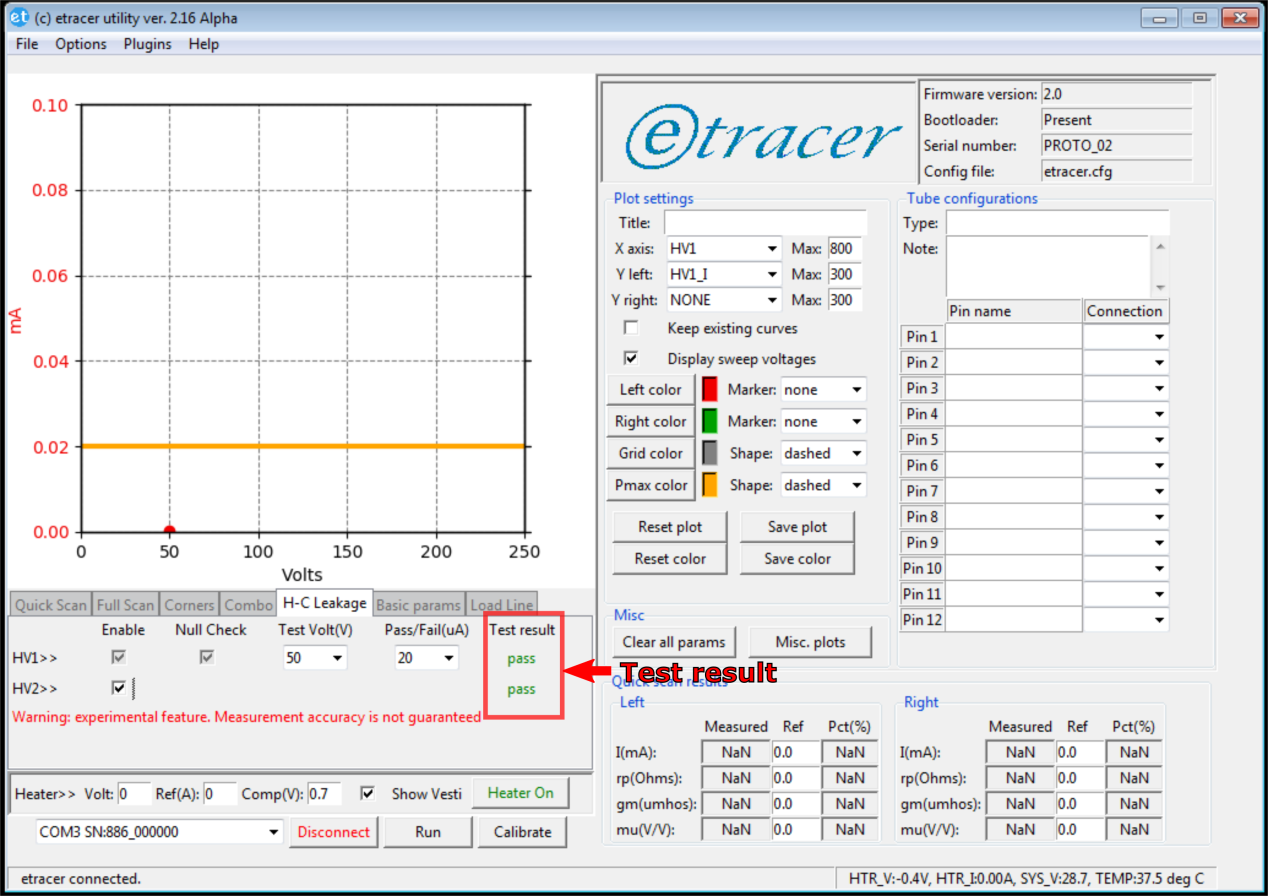
The purpose of the heater-cathode leakage test under the [H-C Leakage] tab is to measure the leakage current between the heater and the cathode of a DUT. A good tube should exhibit a very low leakage current (in the uA range) between heater and cathode. Note this test is only valid for indirectly-heated tubes. The heater-cathode leakage test is a feature that was not planned when the etracer was designed. Due to the restriction of the ADC (Analog to Digital Converter) in etracer the current reading is not accurate in the uA range. Hence the heater-cathode leakage test is designed as a pass-fail test and the resolution of the current reading is 10uA at best. The following figure is a sample output of a heater-cathode leakage test.
Basic Parameters display
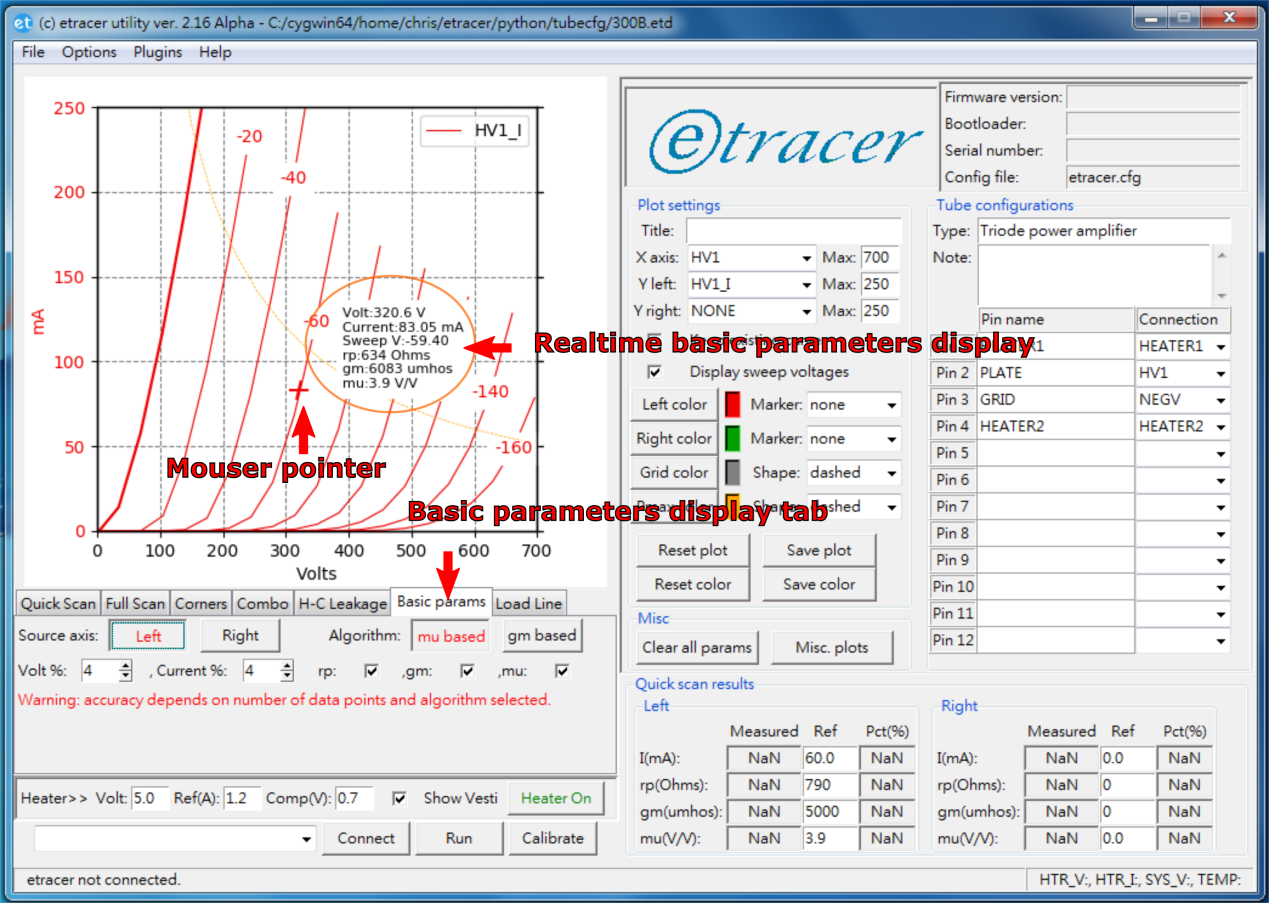
The [Basic params] tab allows the user to check the three basic parameters (rp, mu and gm) following the mouse pointer when a full-scan data is available.
Load line analysis
The [Load Line] tab allows the user to perform load-line analysis for a DUT as a single-ended output stage when a full-scan data set is available. The load-line is represented by two connected lines in the plot: one solid line and one dashed line. The solid line represents the half swing for a sinusoidal waveform while the dashed line represents the other half part of the sinusoidal waveform. The solid line has one circle mark on each end which can be moved by the user by click-and-drag on the mouse. The dashed line will change accordingly to reflect the full load-line. The configuration parameters for the load-line will also be updated on the fly. The user can also enter the parameters in the entry boxes and the load-line will be updated accordingly. If the load resistance is fixed (determined by the load resistance or the impedance of an output transformer) the user can check the “Lock load resistance” checkbox so that the slope of the load-line does not change during mouse-dragging.
The software calculates and updates the reported parameters on the fly. The reported parameters includes the grid bias, the AC output voltage swing, the output power and a THD (Total Harmonic Distortion) and harmonics report based on FFT (Fast Fourier Transform) up to the 7th order. Below figure is a sample load line analysis for a 300B.
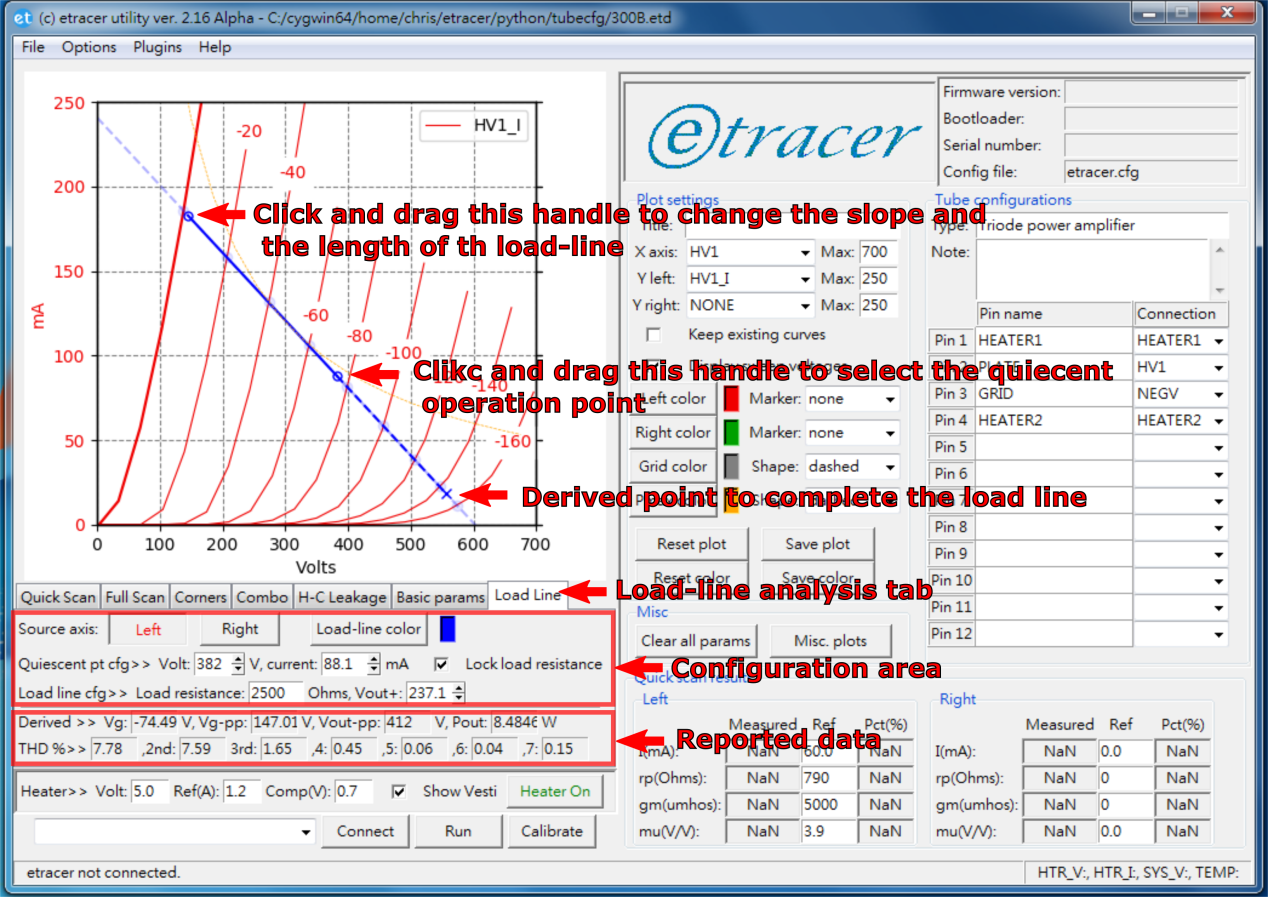
Sample load-line analysis for a 300B