In the Facebook etracer group a member asked how important it is to supply a test voltage beyond 400V. Why can't we just test a tube up to 400V and extrapolate the curves from there. Well, besides the trivial answer that extrapolation is not reliable there are actually situations where extrapolation simply doesn't work.
Simply put, extrapolation relies on the belief that the trend of the curves will continue forever either linearly, exponentially or following a mystic formula. If there is a change in the trend as the plate voltage increases the extrapolation would fail. Here I provide two cases which break the trend:
The first case is for some problematic DUTs the plate voltage for the cut-off region is significantly lower than the good ones. Figure 1 and Figure 2 are two Psvane 300Bs I measured during an audio show in Bangkok early this year. As it can be easily seen the plate current for the problematic 300B (figure 2) at a negative grid voltage of -120 rise from the cut-off (~0mA) region much earlier than the good one.
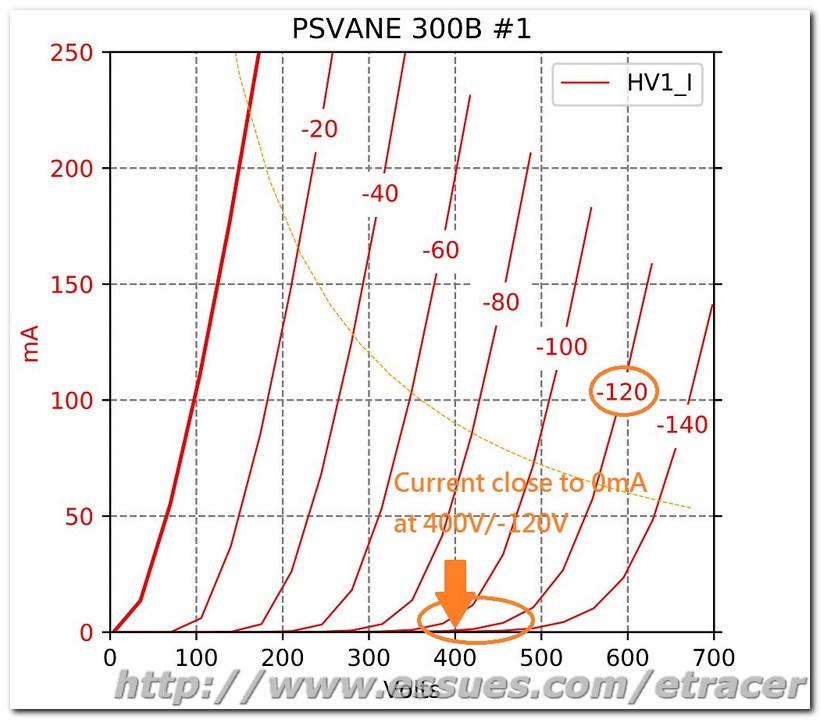 Figure 1. A normal Psvane 300B plate curves
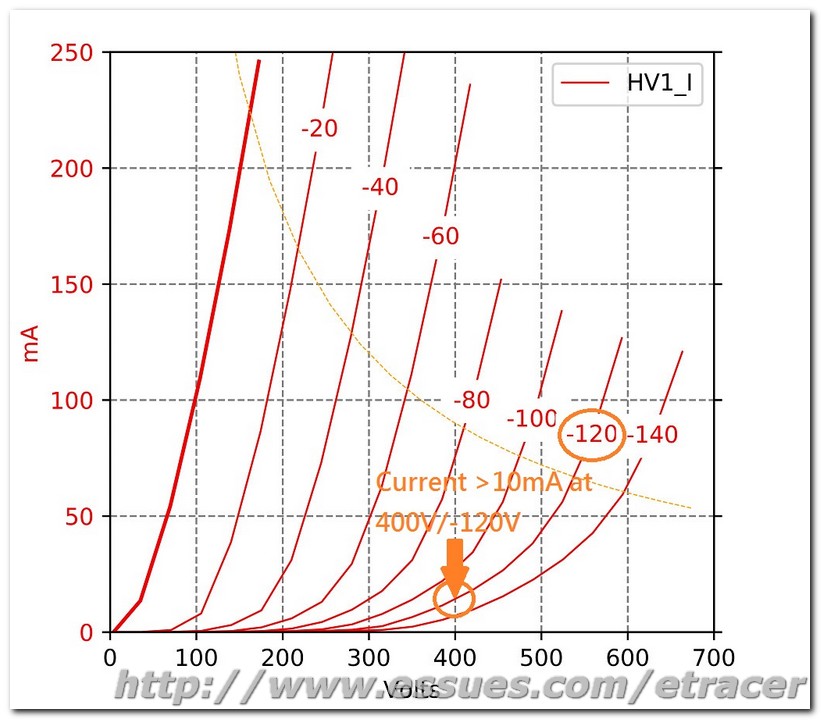
Figure 2. Plate curves for an abnormal Psvane 300B
From the datasheet of the Western Electric 300B we can clearly see a good 300B sample shall have a very low plate current at 400V/-120V.
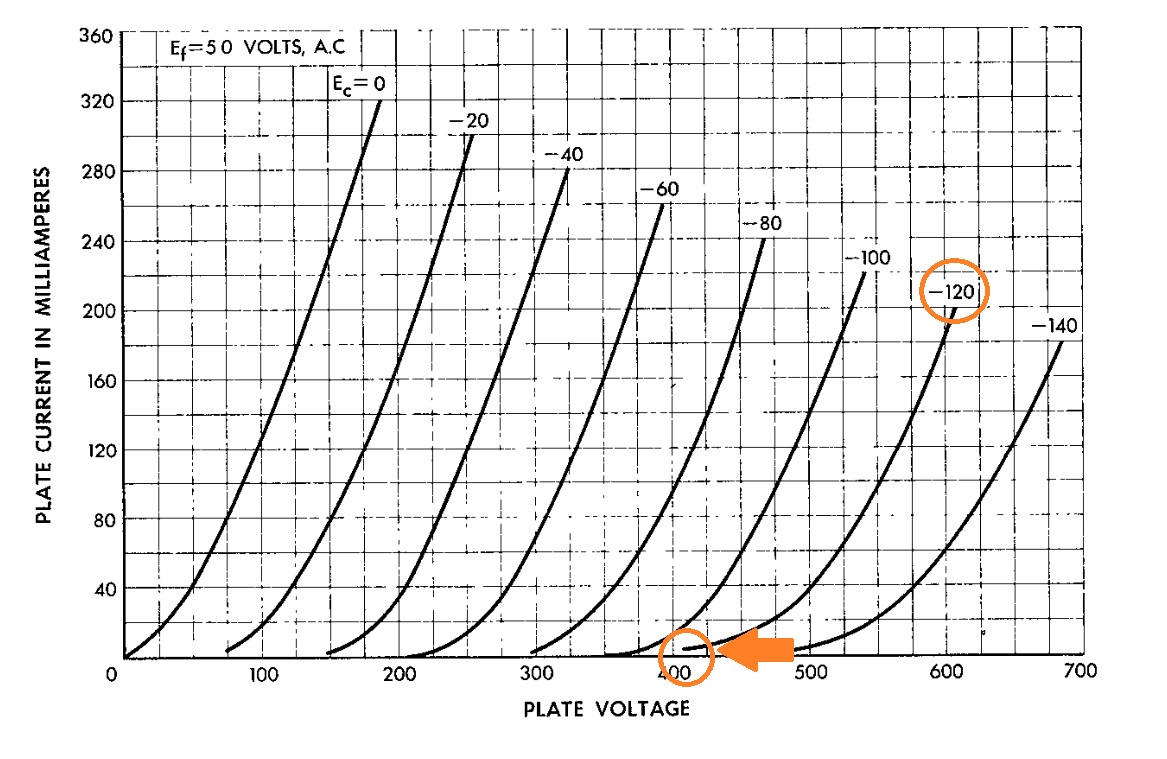
Figure 3. Plate curves from the WE 300B's datasheet
The effect of the skewed curves is a reduced output power and a higher distortion at full output as can be observed using etracer's loadline analysis feature as depicted in figure 4 and figure 5.
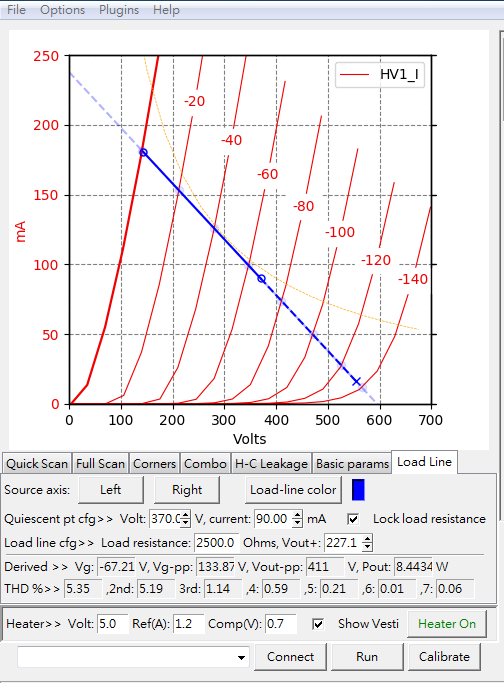 Figure 4. The loadline for the normal Psvane 300B. Output power 8.4W with a THD of 5.35%
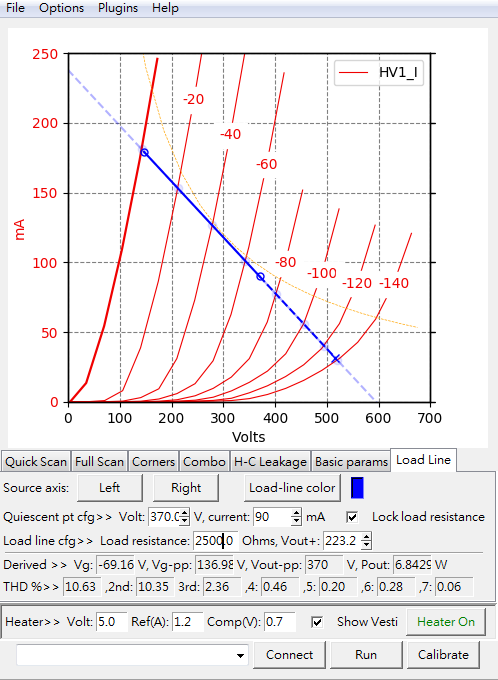
Figure 5. The loadline for the problematic Psvane 300B. Output power 6.8W with a THD of 10.63%
In figure 4 and figure 5 a typical operation point for a 300B with a plate voltage of 370V and a plate current of 90mA is chosen. The load impedance is 2500. It can be seen in figure 5 that the length of the solid blue line is much longer than the dashed blue line compared to figure 4 which indicates strong asymmetry in the output waveform and hence a much higher THD (Total Harmonic Distortion). The output power is also lower for the problematic tube in figure 5 due to the fact that the output voltage swing represented by the dashed blue line is lower compared to the normal tube.
In the facebook discussion a member Kent Leach said he has a similar experience with this kind of early-rising curves behavior when he tested tubes with the Audiomatica Sofia. Kent also indicated that this kind of skewed curves behavior was discussed in a article in Sound Practice Magazine long ago. I did some research and found the article written by J.C. Verdier in SP issue 16. In that article J.C. used a Audiomatica Sofia to measure the plate curves and he discovered some tubes shows a behavior similar to the problem I found in the problematic 300B as depicted below:
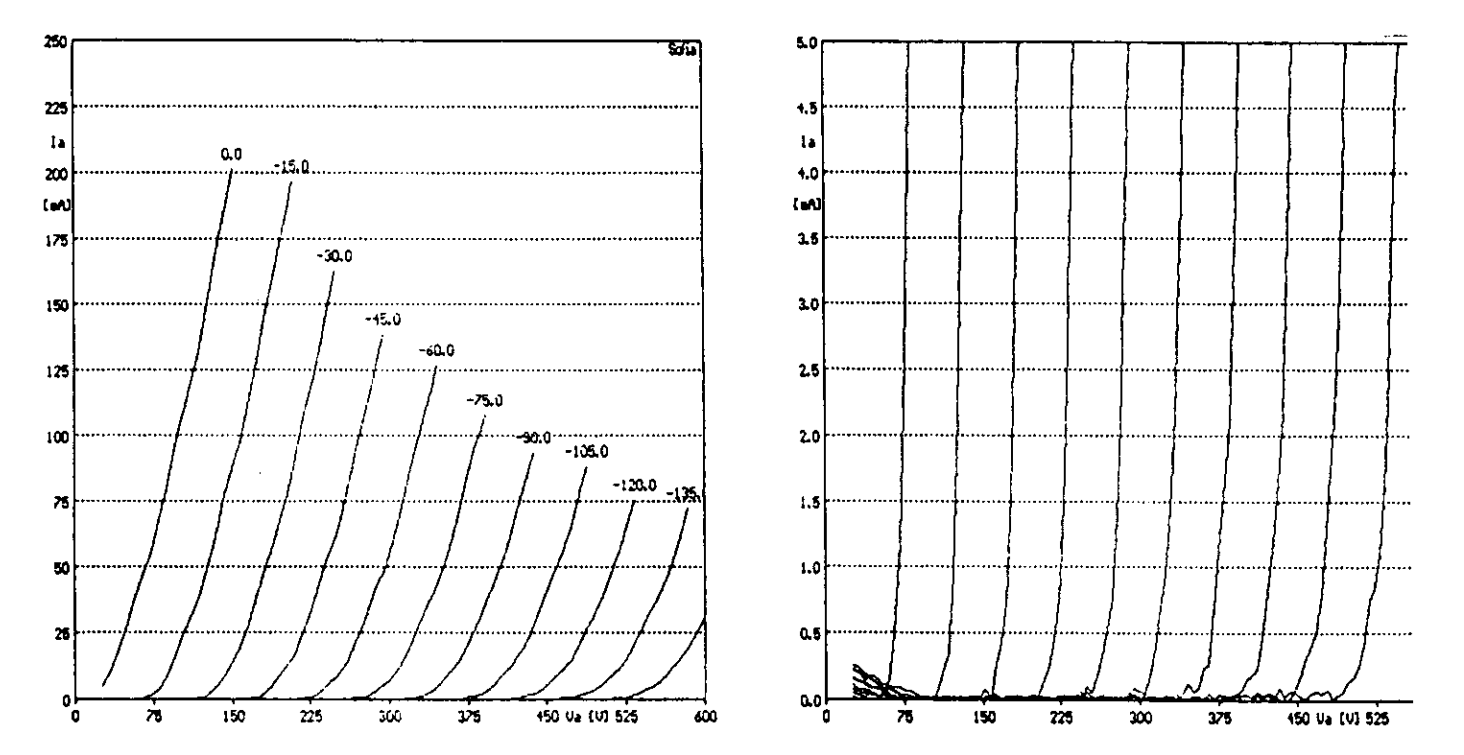 Figure 6. Plate curves for a good 300B from Sound Practice issue 16.

Figure 7. Plate curves for an abnormal 300B from Sound Practice issue 16.
Each figure is split into two subplots. The left subplots have a full-scale of 250mA in the Y-axis while the right subplots have a full-scale of 5mA in the Y-axis to magnify the curves behavior close to 0mA. In his article J.C. indicated this kind of early-rising behavior might be caused by a bad grid winding or misalignment between grid, cathode and anode. J.C. said the bad tube is unusable but the curves look much better than what I got from the bad Psvane 300B.
The second case that breaks the curves trend is short at high plate voltage. This failure mode actually happens much often to me than the skewed curves as in the first case. For this kind of failure the DUT (Device Under Test) tests normal at low plate voltages. When the plate voltage exceeds a certain value there is a sudden increase in the plate current. For example I've tested a Western Electric VT-25 and the curves were perfect when the plate voltage is below 400V. When the plate voltage goes above 400V the plate current went completely nuts. Jac van de Walle of Emission Labs also describes this kind of tube failure in one of his article introducing Sofia: "a tube that appears good at 250V will short circuit at 500 Volts. This can happen if the tube is gassy." The complete article by Jac can be found at this link:http://www.jacmusic.com/Tube-testers/Sofia/Sofia-Index.htm
If a tube with this type of failure is installed in an amplifier the amplifier may play normally below a certain sound level. When the volume is cranked up or a peak in the music is reached the sound breaks abruptly with noise spikes.
In order to filter bad tubes in the two cases above we need a test voltage that is as high as the maximum plate voltage in the real circuit or even slightly higher to have some margin. For example, the plate voltage for the 300B in figure 5 is about 550V at full output. A test voltage of 600V is adequate. Note this is for single-ended class A operation only. For other circuit topologies such as class A2 or class B a higher test voltage maybe needed. In the etracer software I added a corner-test feature to the PC software which supports tests of 4 corner cases. I use two of the tests cases to filter out the aforementioned two behaviors for a bad tube. For 300B the first test case has a plate voltage of 400V and a negative grid voltage of -120V. Under this point the plate current should be below 2mA to pass the test. This will capture the bad tubes that has early-rise curves. The second test case has a plate voltage of 700V and a negative grid voltage of -160V. Under this point the plate current should be below 200mA to pass the test. 200mA is twice of the current value for a new 300B and anything above it the user should be notified.
As a conclusion a high test voltage in a tube tester reveals problems that can not be found by tube testers with insufficient test voltage.